


We often misinterpret the high inter-rater reliability often obtained with behaviorally anchored rating scales (BARS). We commonly assume that high inter-rater reliability of grading panels indicates that scoring is reliable and, by inference, accurate. Rarely, if ever, do we evaluate the reliability between grading panels. Presented here are data from the scoring of 22 police promotional examination exercises. High within-panel Spearman-Brown grade reliability statistics sometimes coexist with low between-panel grade correlations. Between-panel correlations are rarely as high as would be expected based on the within-panel reliability of the pairs of panels. It may be that individual rater panels develop their own idiosyncratic grading criteria, despite all panelists receiving the same thorough training before live grading.
Introduction
Inter-rater reliability of grading with a BARS is generally high (e.g., 0.77, Levashina et al., 2014, page 273; and 0.84, McDaniel et al., 1994, Table 2 for structured interviews). Low inter-rater reliability is taken as an indication of grading deficiency and high inter-rater reliability is considered desirable (preferably 0.95 or higher, and at least 0.90, according to Nunnally & Bernstein, 1994, page 265). However, there is almost no literature that evaluates BARS rater- reliability across two rater panels scoring the same candidates on the same exercises. I encountered such data in my consulting work, as reported below.
Method
Data were available for 12 exercises administered as part of promotional examinations for police sergeant that were given biannually from 2013 to 2023. Each examination year included an oral panel component consisting of two new, independent exercises. Each exercise was graded by two independent rater panels, each composed of three raters. Different raters graded the two exercises. The raters were all current Sergeants or Lieutenants in comparable police departments located in various states other than the location of the examination. A small number of raters graded more than one examination. Each year there were somewhat more than 100 test takers. Some candidates took the promotional examination more than once, in different years.
The exercises simulated the work of a police sergeant including, for example, a one-on-one discussion with a subordinate experiencing some difficulties, addressing a group of subordinates on a critique of an emergency scene, or addressing a civilian or a group of civilians on topics such as community policing or crime in the neighborhood.
Each exercise was graded on four dimensions. The dimensions rated varied by exercise and year and typically included such dimensions as: Oral Communication, Interpersonal Relations, Supervision, Problem Analysis, and Problem Resolution. A candidate’s score for an exercise was the average of 12 BARS ratings (3 raters on 4 nine-point BARS scales).
Rater training was conducted before any rating of actual test takers. This training included: job duties of a Sergeant, the BARS methodology, focusing on behaviors rather than general impressions, common rater errors, and practice in grading the exercises. In live rating, initial ratings were made prior to any discussion. Large discrepancies among the raters on any dimension were discussed followed by the raters making their final ratings. Consensus was not required. Only the final ratings are reported below but the pattern is very similar for the initial ratings.
Before COVID, from 2013 to 2019, one panel both administered and graded the exercise and the second panel graded the candidates based on video recordings. After COVID, in 2021 and 2023, the exercises were administered by video and both panels graded the candidates based on the video recording.
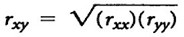
The Spearman-Brown reliability for the pairs of panels was used to predict the expected correlation between-panels using this formula (Ghiselli, Campbell, & Zedeck, 1981, page 242):
Results
Within-panel Spearman-Brown reliability was high was high, averaging 0.91. The predicted correlation between-panels, based on within-panel reliability, was also high, averaging
0.91. However, the observed correlation between-panels was lower, at 0.60. The ratio of the observed to the expected between-panel correlations, expressed as a percent, averaged 66%, meaning there was a 34% average shrinkage from the expected to the observed between-panel correlation. (See Table 1.) Parenthetically I note that 8 exercises from 4 promotional examinations for Lieutenant, with from 24 to 38 test takers, show the same pattern of shrinkage for some but not all exercises.
|
Table 1. Within-panel Reliability and Between-panel Correlation by Year and Exercise |
|||||||
|
Year |
Ex. |
Reliability Within- panel 1 |
Reliability Within- panel 2 |
Observed Correlation Between- panels |
Expected Correlation Between- panels |
Percent (observed/ expected) |
Shrinkage |
|
2013 |
1 |
0.92 |
0.92 |
0.46 |
0.92 |
50% |
50% |
|
2013 |
2 |
0.89 |
0.86 |
0.48 |
0.87 |
55% |
45% |
|
2015 |
1 |
0.89 |
0.95 |
0.48 |
0.92 |
52% |
48% |
|
2015 |
2 |
0.89 |
0.87 |
0.77 |
0.88 |
87% |
13% |
|
2017 |
1 |
0.88 |
0.80 |
0.76 |
0.84 |
90% |
10% |
|
2017 |
2 |
0.85 |
0.89 |
0.66 |
0.86 |
76% |
24% |
|
2019 |
1 |
0.97 |
0.91 |
0.44 |
0.94 |
47% |
53% |
|
2019 |
2 |
0.97 |
0.94 |
0.66 |
0.96 |
69% |
31% |
|
2021 |
1 |
0.86 |
0.90 |
0.48 |
0.88 |
55% |
45% |
|
2021 |
2 |
0.96 |
0.96 |
0.71 |
0.96 |
74% |
26% |
|
2023 |
1 |
0.94 |
0.94 |
0.64 |
0.94 |
68% |
32% |
|
2023 |
2 |
0.94 |
0.94 |
0.70 |
0.94 |
74% |
26% |
|
Means |
0.91 |
0.91 |
0.60 |
0.91 |
66% |
34% |
|
Discussion
Possible explanations for these findings can be visualized with a Venn diagram (see Figure 1). On the positive side, the use of two rater panels may increase validity (see areas B and C, as each panel may capture valid aspects missed by the other panel. On the negative side, the observed agreement between panels may include invalid variance (see area D), due to scoring of invalid factors (e.g., a person’s physical size). Areas E and F must include systematic as well as random error since the within-panel reliability is always 0.85 or higher. The systematic error not shared between panels may reflect idiosyncratic, panel-specific grading criteria (perhaps similar to measurement error).
The lower circle in Figure 1 is labeled “A full credit answer” rather than “The correct answer” because there may be more than one correct way to address complex work situations. The possibility of multiple correct answers could explain some of the shrinkage seen in
Table 1, but is not considered further here.
One implication of this research is clear: using two BARS rating panels to grade complex job simulation exercises is now highly desirable, or even best practice.
Future research should try to identify the cause of low between-panel correlation seen in the grading of some exercises. Such future research might include:
- having each pair of panels meet together to talk about the candidates whose scores show the most discrepancies,
- having the agency staff who facilitated each pair of panels meet to talk about the candidates whose scores show the most discrepancies,
- having the agency staff who facilitate the rating panels swap places midway through the grading to try to detect differences in grading criteria between panels,
- doing a content analysis of the various exercises to try to identify the type of exercise that have low or high between panel correlations, and
- analyzing the data to try to identify the dimensions associated with low or high between panel correlations.
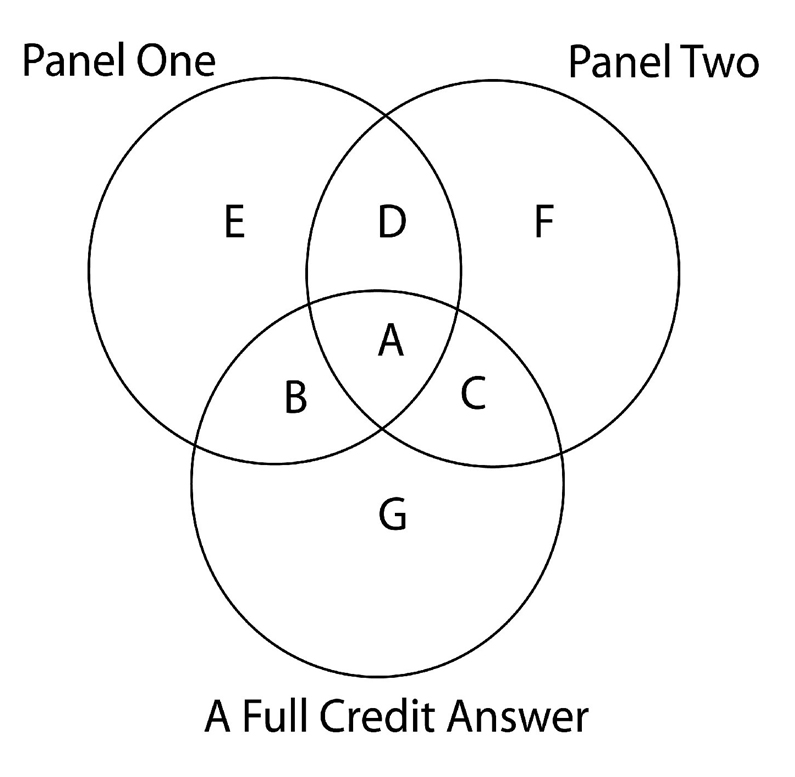
Figure 1. Venn Diagram Showing Possible Valid and Invalid Variance in Grading
Key:
- Valid variance identified by both rater panels
- Valid variance identified by panel 1 but not panel 2
- Valid variance identified by panel 2 but not panel 1
- Invalid agreement between the two panels
- Invalid variance exhibited only by panel 1 (both random and panel specific)
- Invalid variance exhibited only by panel 2 (both random and panel specific)
- Valid variance missed by both panels
Conflict of interest statement
I gained access to the examination statistics in the first 5 columns of Table 1 in my consulting role. These statistics were computed by the client as part of their standard post-examination analyses. The client did not influence my interpretation or the content of this article. I have no other potential conflicts of interest to disclose.
References
Ghiselli, E. E., Campbell, J. P., & Zedeck, S. (1981). Measurement theory for the behavioral sciences. San Francisco, CA: Freeman.
Levashina, J., Hartwell, C. J., Morgeson, F. P. & Campion, M. A. (2014) The structured employment interview: narrative and quantitative review of the research literature. Personnel Psychology, 67, 241- 293.
McDaniel, M. A., Whetzel, D. A., Schmidt, F. L. & Maurer, S. D. (1994). The validity of employment interviews: A comprehensive review and meta-analysis. Journal of Applied Psychology, 79, 599-616.
Nunnally, J. C., & Bernstein, I. H. (1994). Psychometric theory (3rd ed.) New York: McGraw-Hill.
Joel P. Wiesen, PhD
Applied Personnel Research