
Statistics is a foundational requirement for students across numerous disciplines, equipping them with essential skills to conduct research, analyze data, and critically interpret information in an increasingly data-driven society. Students in the social sciences, particularly in psychology, are often assumed to experience anxiety towards statistics, with a significant body of literature identifying negative traits associated with statistics anxiety. For example, lower academic achievement (Paechter et al., 2017), procrastination (Onwuegbuzie, 2004), and academic dishonesty (Eshet et al., 2021) have all been linked to statistics anxiety. Consequently, many researchers have examined strategies and interventions to reduce statistics anxiety (e.g., Yang et al., 2021; Riach et al., 2025; Valle et al., 2021; Smith & Capuzzi, 2019).
Although it is clear that statistics anxiety can be an issue for students, few studies have appropriately quantified its prevalence. Existing studies tend to use unique operationalizations of statistics anxiety and rely on small samples from varying disciplines, which has resulted in a wide range of prevalence estimates, from ~54% (Alizamar et al., 2019) up to 92.3% (Tutkun, 2019) of students. The most commonly referenced rate is that up to 80% of students experience statistics anxiety, generally cited as Onwuegbuzie and Wilson (2003), which itself references an in-press article by the same primary author as the original source. However, this in-press article, titled Prevalence of Statistics Anxiety Among Graduate Students, appears to have never been published. Nothing is known about how statistics anxiety was measured or the sample(s) from which this rate was drawn, only that they are graduate students (a frequently omitted characteristic in citing papers). Despite this estimate being unreliable, of 67 peer reviewed articles assessing statistics anxiety published since 2003 identified within the present study, 30 explicitly cited it. It is therefore clear that more research is needed to quantify the degree of statistics anxiety experienced by students.
We aim to estimate the amount of statistics anxiety experienced by students using a meta-analytic approach in this study. Specifically, average responses on the most common measure of statistics anxiety, the Statistics Anxiety Rating Scale (STARS, Cruise et al., 1985), are examined. We hope the results can guide statistics educators to re-evaluate their treatment and discussion of statistics anxiety in their classroom, and to inform future research on statistics anxiety.
Methods
The STARS contains 51 items asking participants about their anxiety and attitudes towards statistics, with responses measured on a 5-point Likert scale. Three subscales (26 items) intend to measure students’ statistics anxiety: a) test and class anxiety, b) interpretation anxiety, and c) fear of asking for help. A response of 1 typically indicates no anxiety and a response of 5 indicates substantial or high anxiety. The overall mean response on each subscale, and associated heterogeneity should provide insight into the extent to which students experience statistics anxiety, on average, and how stable this estimate is.
The search process for studies to be included in the final analysis was comprehensive, including peer reviewed and non-peer reviewed sources (open access datasets, preprints, dissertations). To be eligible for inclusion, studies had to provide a sample size, mean, and standard deviation for at least one subscale of the STARS, and be available in English. Data sources were identified first by searching for the term “Statistics Anxiety Rating Scale” in ERIC, SCOPUS, APA PsycArticles, ProQuest Dissertations & Theses, and Open Science Framework. This search term was then used again to identify more articles in the Statistics Education Research Journal, and the Journal for Statistics and Data Science Education. Finally, reference lists of recent articles and systematic reviews (e.g., Nesbit & Bourne, 2018) were searched. The total number of data sources identified as eligible for inclusion was 83, with most (86.7%) being peer reviewed articles. Data from approximately 29,000 unique participants for each subscale are represented in these data sources.
Although data came from 83 data sources, more independent samples were available for analysis. Several articles published only descriptive statistics grouped by sex, age, or course, producing more samples than data sources. If data from multiple time points were available, only the first time point was analyzed to ensure that no participants or samples had a disproportionate influence on the results. Overall, data from 181 independent samples were analysed across the subscales. A single study (SMARVUS; Terry et al., 2023) provided data from 80 usable sub-studies from around the world.
In total, 181 samples from 43 countries spanning every continent reported information for at least one anxiety subscale. Although the sample was generally diverse, 44.8% of samples were collected in England or the USA. Participants were primarily young adults (average of sample means for age: M = 25.14 years), female (average of sample percentages: M = 75.9%), undergraduate students (82.4% of samples), and enrolled in psychology programs (67.8% of samples reporting a specified major, 45.6% of all samples).
Results
All analyses were conducted in R 4.3.3 (R Core Team, 2024). We applied random-effects models using the metafor package (Viechtbauer, 2010) to estimate the aggregate means for each STARS subscale. The overall estimate of each subscale mean, associated 95% confidence interval, and heterogeneity estimates are presented in Figure 1. Mean estimates and confidence intervals are between 2 and 3 for the Interpretation Anxiety and Fear of Asking for Help subscales, indicating mild to moderate anxiety in these domains. The estimate for Test and Class Anxiety is slightly above 3, indicating moderate anxiety. As indicated by the reported tau-squared estimates and the wide distribution of sample means, heterogeneity was moderate within subscales.
Figure 1
Distribution of sample means by subscale with associated summary statistics
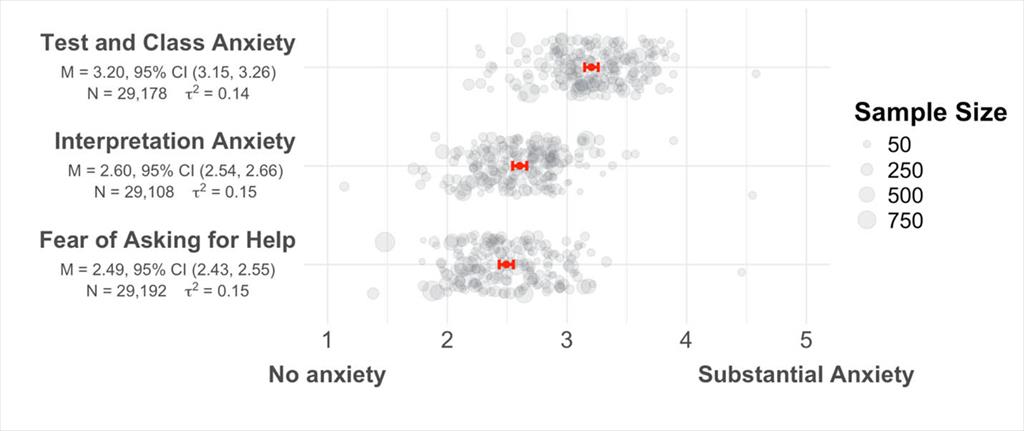
Note. Each point represents the subscale mean reported within a single independent sample. The estimated aggregate mean and 95% confidence interval are indicated in red.
Discussion
These results contrast with the pervasive narrative that statistics anxiety is overwhelmingly present and debilitating for students. In fact, this meta-analysis suggests that most students experience mild to moderate statistics anxiety as measured by the STARS. Consequently, most students are not experiencing statistics anxiety harmful for course success. In fact, the Yerkes-Dodson law suggests that mild to moderate anxiety levels facilitate course performance – a finding supported by Keeley et al. (2008). Overall, these results indicate that while some students may be highly anxious towards statistics, it appears misguided to approach teaching statistics courses with the assumption that most students are highly anxious. A more effective approach could be to let students share their experience and provide targeted support to those who need it.
Another interpretation of these results is that we are facing a measurement problem. Statistics anxiety is frequently assessed at the beginning of statistics courses, when students may have little prior exposure and thus lack the experience needed to accurately judge their anxiety. Additionally, we are unconvinced that the Fear of Asking for Help and Test and Class Anxiety subscales are tapping into the statistics anxiety that is actually experienced by students. Neither of these constructs are specific to the statistics classroom or align with the experiences shared with us by students. Instead, in our experience, anxiety in the statistics classroom is more closely tied to students’ self-assessed low statistical competence, fear of failure, and an unclear understanding of what statistics courses entail.
Despite a breadth of research on statistics anxiety existing, these results highlight several foundational questions that remain unresolved, including how to define it, when and how to measure it, and what proportion of students are meaningfully hindered by it.
Contact
 Johanna V. Loock
Student, Psychological Science
Psychology and Statistics Education Research (PASER) Lab, Toronto Metropolitan University
 Alyssa Counsell, PhD
Associate Professor, Department of Psychology
Director, PASER Lab, Toronto Metropolitan University
Related Resources
Alizamar, A., Afdal, A., Ifdil, I., Ardi, Z., Ilyas, A., Zikra, Z., Daharnis, D., Firman, F., Nirwana, H., Mudjiran, M., Azhar, Z., Sukmawati, I., Sukma, D., Nurfarhanah, N., Hariko, R., Syahniar, S., Fikri, M., Trizeta, L., Saputra, Y., … Febriani, R. D. (2019). Are there statistical anxiety differences between male and female students? Journal of Physics: Conference Series, 1157, 042127. https://doi.org/10.1088/1742-6596/1157/4/042127opens in new window
Cruise, R. J., Cash, R. W., & Bolton, D. L. (1985). Development and validation of an instrument to measure statistical anxiety. In American Statistical Association Proceedings of the Section on Statistical Education 4(3), 92-97).
Eshet, Y., Steinberger, P., & Grinautsky, K. (2021). Relationship between Statistics Anxiety and Academic Dishonesty: A Comparison between Learning Environments in Social Sciences. Sustainability, 13(3), 1564. https://doi.org/10.3390/su13031564opens in new window
Keeley, J., Zayac, R., & Correia, C. (2008). Curvilinear Relationships Between Statistics Anxiety and Performance Among Undergraduate Students: Evidence For Optimal Anxiety. Statistics Education Research Journal, 7(1), 4–15. https://doi.org/10.52041/serj.v7i1.477opens in new window
Nesbit, R. J., & Bourne, V. J. (2018). Statistics Anxiety Rating Scale (STARS) Use in Psychology Students: A Review and Analysis with an Undergraduate Sample. Psychology Teaching Review, 24(2), 101–110.
Onwuegbuzie, A. J., & Wilson, V. A. (2003). Statistics Anxiety: Nature, etiology, antecedents, effects, and treatments--a comprehensive review of the literature. Teaching in Higher Education, 8(2), 195–209. https://doi.org/10.1080/1356251032000052447opens in new window
Onwuegbuzie, A. J. (2004). Academic procrastination and statistics anxiety. Assessment & Evaluation in Higher Education, 29(1), 3–19. https://doi.org/10.1080/0260293042000160384opens in new window
Paechter, M., Macher, D., Martskvishvili, K., Wimmer, S., & Papousek, I. (2017). Mathematics Anxiety and Statistics Anxiety. Shared but Also Unshared Components and Antagonistic Contributions to Performance in Statistics. Frontiers in Psychology, 8, 1196. https://doi.org/10.3389/fpsyg.2017.01196opens in new window
R Core Team (2024). R: A Language and Environment for Statistical Computing. R Foundation for Statistical Computing, Vienna, Austria. https://www.R-project.org/opens in new window.
Riach, A. C., Shaker, A. J., Marshall, E., Binkowski, K. P., & Kay, W. P. (2025). A comparison of strategies used by lecturers to improve students’ perceived feelings toward statistics—A study that is Stat‐tastic! Teaching Statistics, test.12408. https://doi.org/10.1111/test.12408opens in new window
Smith, T. F., & Capuzzi, G. (2019). Using a Mindset Intervention to Reduce Anxiety in the Statistics Classroom. Psychology Learning & Teaching, 18(3), 326–336. https://doi.org/10.1177/1475725719836641opens in new window
Terry, J., Ross, R. M., Nagy, T., Salgado, M., Garrido-Vásquez, P., Sarfo, J. O., Cooper, S., Buttner, A. C., Lima, T. J. S., Öztürk, İ., Akay, N., Santos, F. H., Artemenko, C., Copping, L. T., Elsherif, M. M., Milovanović, I., Cribbie, R. A., Drushlyak, M. G., Swainston, K., … Field, A. P. (2023). Data from an International Multi-Centre Study of Statistics and Mathematics Anxieties and Related Variables in University Students (the SMARVUS Dataset). Journal of Open Psychology Data, 11(1), 8. https://doi.org/10.5334/jopd.80opens in new window
Tutkun, T. (2019). Statistics Anxiety of Graduate Students. International Journal of Progressive Education, 15(5), 32–41. https://doi.org/10.29329/ijpe.2019.212.3opens in new window
Valle, N., Antonenko, P., Valle, D., Sommer, M., Huggins-Manley, A. C., Dawson, K., Kim, D., & Baiser, B. (2021). Predict or describe? How learning analytics dashboard design influences motivation and statistics anxiety in an online statistics course. Educational Technology Research and Development, 69(3), 1405–1431. https://doi.org/10.1007/s11423-021-09998-zopens in new window
Viechtbauer, W. (2010). Conducting Meta-Analyses in R with the metafor Package. Journal of Statistical Software, 36(3). https://doi.org/10.18637/jss.v036.i03opens in new window
Yang, S., Hazlehurst, J., & Taniguchi, D. A. A. (2021). Cats Teach Stats. The American Biology Teacher, 83(8), 542–544. https://doi.org/10.1525/abt.2021.83.8.542opens in new window