


Parsimony, according to Johnson and Tallant (2017), could be qualitative (which explains type) or quantitative (which explains size). A qualitative parsimony minimizes the types of postulated entities while a quantitative parsimony minimizes the number of postulated entities. However, although Fisher et al. (2024) lamented that “too much of a good thing may be bad”, the more quantitatively parsimonious theories are mostly preferred because of assured probabilistic justifications that correspond with specific chosen theory (Kelley et al., 2003; Johnson & Tallant, 2017). The parsimonious model originated from law of briefness (rendered as lex parsimoniae in Latin), popularly referred to as Occam’s razor, which provides that only necessary things should be used (Gen, 2015). The said necessary things, in the context of parsimonious model, are “parameters”. Matthiessen (2022) proposes an account of accurate scientific representation, which Gandi (2025) corroborates, in terms of suitable techniques that produce data from a target phenomenon. It considers an approach to accurate representation from epistemic factors, justified by Ontic Priority, which holds that the criteria for representational accuracy depend on a pre-established account of the nature of relationship between a model and its target phenomenon (Roberts, 2009). This concurs with the position that achieving parsimony requires reducing parameter, because a parsimonious model needs fewer parameters for more efficient estimation. This suggests that a good knowledge of parsimony and parameter will translate into developing more effective and efficient models that accurately describe complex phenomena (Howell, 2012; Mueller, et al. 2018).
Design and Procedure
The study adopted systematic review of published studies (1965-2025) on accuracy, parameter, parsimony, and precision were methodically performed and a meta-analysis conducted. It seeks to determine possibility of any inference(s) or correlation(s) between parsimony-parameter model equation in consonance with evidential accuracy and precision as applied to measurement quality. Consequently, the psychometrics of the two one-sided tests (TOST) for two proportions’ equivalence ratio tests (Lakens, 2017), the Neyman-Pearson analysis for testing pre-specified type 1 error rate (Roberts, 2019), and the I-squared (I2) statistic for heterogeneity (consistency) checks were used. The overall procedural nitty-gritty includes the following:
Step 1: Protocol development. The study protocol does not require formal approval from ethics committee, but informed consent from some authors.
Step 2: Information sources and search. The databases with dates of coverage and other information were sourced from SciSearch, PubMed/Medline, PsycInfo, PsycARTICLES, PsycTests, and PsycEXTRA.
Step 3: Defining eligibility criteria for the data to be included. Compatible articles were defined and those to be assessed and selection done based on the concepts under consideration.
Step 4: Strategy delineation for identifying the relevant studies. Study selection includes screening and eligibility for both systematic review and meta-analysis, according to the research question and the relevance of study. This facilitated selecting particular studies for inclusion in the analysis.
Step 5: Creating standardized form(s) for data collection. Standardized forms, blinded to all identifying factors such as authors and their institutions, names of journals, sources of funding, and acknowledgements, were provided to observers who facilitated reliable data extraction.
Step 6: Data extraction and risk of bias assessment. Titles and abstracts were screened by two reviewers whose respective inputs contributed to avoiding risk of bias and ensuring appropriate data extraction.
Step 7: Standardize individual results for comparison between studies. Results for homogeneity were standardized to something homogenous while the mean difference were extracted for continuous outcomes while the odd ratios considered for binary outcomes.
Step 8: Overall effect calculation by combining the data. Differences in statistical power showed fixed effect and random effect models’ weighted average with more influence than the smaller ones.
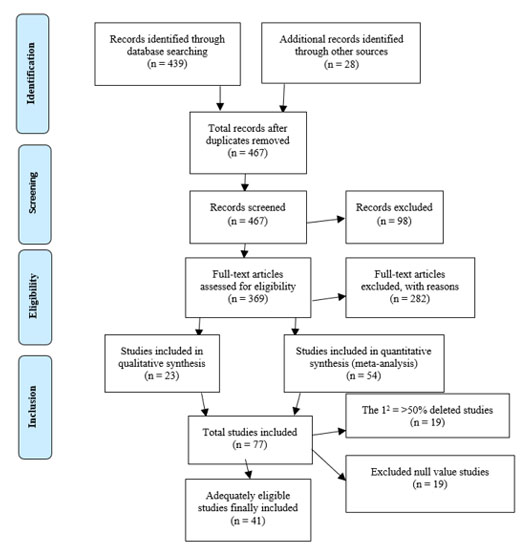
Figure 1
Article Selection, Screening, Eligibility, and Inclusion Flow Chart
Results
Screening and assessment of the initial 112 candidate studies for eligibility, during initial study selection, have dropped 45 and retained 67 candidate studies at the first instance. From the resulting 67 studies, 30 were further excluded as noted on flow chart (Figure 1) for the purpose of avoiding possible within studies risk of bias. Thirty-seven studies, consisting of 12 qualitative and 25 quantitative syntheses, were retained for heterogeneity check to ensure consistency. Consequently, in light of the candidate studies retained (for the said accuracy), I-squared (I2) detected the presence of heterogeneity by showing the I2 value as >50% for 19 individual studies which were thereafter deleted for inconsistency. From the remaining 18 studies sequel to I2 check, it was further discovered that three studies had various null values (suggesting if it were on forest plot) they would be described as having crossed the vertical line and are lying within 95% confidence intervals. The three candidate studies were excluded for lack of statistically significant difference, leaving 15 studies as more eligible in every sense of it. By and large, the synthesis corroborates rejection of effect sizes larger than equivalence bounds [0.9 and 1.1 (H0: P1/P2 < 0.9 or P1/P2 > 1.1 versus H1: 0.9 < P1/P2 < 1.1)] which (by implication) pre-specified type 1 error rate. From this analytic synthesis, the forest plot (Figure 2) seems to significantly corroborate the flow chart (Figure 1) in terms of study output and outcome.
Discussion and Conclusion
Measurement of a property involves assignment of numbers to the relational systems representing that property. Meta-analysis in this case benefitted from I-squared (I2) statistic because inconsistency among candidate studies can affect validity and allow (at most) only a predictive interval instead of a valid confidence interval. The inconsistency detected by I2 in the study can be blamed to whether methodological deficiency, analytical irrelevance, or impact of bias. Inclusion of any of the studies with I2 as >50% in the meta-analytical results will lead to questionable conclusions from what the study forest plot depicts. The study supports hypothetical assumption that the “parsimony-parameter" model facilitates ensuring significant evidential accuracy and precision by capturing important features of the phenomenon that it purports to represent. Therefore, any inference from the model in this case also applies to the associated phenomenon or to the realities of the situation and not only to itself. On this note, it is worth concluding that the parsimony-parameter model is a significant match for determining psychometric soundness which lends credence to measurement quality.
References
Fisher, A. V., Godwin, K. E., & Seltman, H. (2014). Visual environment, attention allocation, and learning in young children: When too much of a good thing may be bad. Psychological Science, 25(7), 1362-1370. https://doi.org/10.1177/0956797614533801opens in new window
Gandi, J. C. (2025). Meta-analysis on parsimony-parameter model for evidential precision and accuracy. African Journal for the Psychological Studies of Social Issues, 28(4), 361-370.
Glen, S. (2015). Parsimonious model: Definition, ways to compare models. https://www.statisticshowto.com/parsimonious-model/
Howell, D. C. (2012). Statistical methods for psychology. Cengage Learning.
Johnson, L., & Tallant, J. (2017). Quantitative parsimony: Probably for the better. The British Journal for Philosophy of Science, 68(3), 781-803. https://doi.org/10.1093/bjpsaxv064
Kelley, K., & Maxwell, S. E. (2003). Sample size for multiple regression: Obtaining regression coefficients that are accurate, not simply significant. Psychological Methods, 8(3), 305-321. https://doi.org/10.1037/1082-989X.8.3.305
Lakens, D. (2017). Equivalence tests: A practical primer for t tests, correlations, and meta-analyses. Social Psychological and Personality Science, 8(4), 355-362. https://doi.org/10.1177/1948550617697177
Matthiessen, D. (2022). Empirical techniques and the accuracy of scientific representations. Studies in History and Philosophy of Science, 94, 143-157. https://doi.org/10.1016/j.shpsa.2022.06.002
Mueller, M., D’Addario, M., Egger, M., Cevallos, M., Dekkers, O., Mugglin, C., & Scott, P. (2018). Methods to systematically review and meta-analyse observational studies: a systematic scoping review of recommendations. BMC Medical Research Methodology, 18(44), 1-18. https://doi.org/10.1186/s12874-018-0495-9
Roberts, F. S. (2009). Measurement theory. In G. Rota (ed.), Encyclopedia of mathematics and its applications (Vol. 7). Cambridge University Press.
Author
 Joshua Chiroma Gandi, PhD
Department of Psychology, Nigerian Defence Academy, Kaduna
Email